
The guide
Every ad account argument starts with the wrong number. A founder celebrates a 4x ROAS. An agency reports a 2.5x ROAS like it is a grade. A media buyer scales the campaign with the highest ROAS in the account. All three are judging a number that, on its own, says nothing about profit. Return on ad spend is revenue divided by ad spend — and revenue is not profit. A campaign returning four dollars of revenue for every dollar of spend loses money if it costs more than four dollars of revenue to fulfil the order behind it. A campaign returning 1.8x makes money if the order behind it keeps more than half its value after costs. The ROAS number is not the verdict. The verdict is the ROAS number compared against your break-even ROAS — the point where ad spend exactly eats what each order contributes. This article finds that number for a worked example, shows how to find yours, and turns it into a target you can actually run campaigns against.
Revenue is not profit, so a ROAS number alone tells you nothing. One worked example, the single formula behind it, and the target ROAS that turns the floor into a plan.
Key takeaways
What ROAS actually measures, and what it hides
ROAS is a simple ratio: revenue attributed to ads, divided by ad spend. Spend 1,000 dollars, attribute 3,000 dollars of revenue, and the dashboard shows 3.00x. Nothing in that calculation knows what the orders cost you.
It does not subtract the product inside the box, the postage to send it, the payment fee on the transaction, or the refund that came back a week later. It also counts the full order value before refunds, and it blends in returning customers who may well have bought without the ad.
That is why two stores can both report 3x and be in opposite financial positions: one keeps 60 cents of every revenue dollar after order costs and profits handsomely; the other keeps 20 cents and loses money on every order the ads drive.
This is not a flaw in the metric so much as a flaw in how it is read. ROAS is a revenue-efficiency number, and it is genuinely useful for comparing campaigns inside one account, where the margin behind every order is roughly the same.
The moment it is quoted as a standalone grade — "we hit 4x" — it stops describing the business and starts describing the dashboard. The question to ask about any ROAS figure is never "is that high?" but "high compared to what this order can afford?" And that second number has a name: break-even ROAS.
The one formula: break-even ROAS equals 1 divided by contribution margin
Strip an order down to what matters for ad decisions. Revenue per order is the average order value. From it, subtract everything the order itself costs before advertising: product cost, shipping and fulfilment, payment and platform fees, and expected refunds.
What remains is the contribution per order — the money each order contributes toward ads and profit. Divide that by the order value and you have the contribution margin, as a percentage. Break-even ROAS is 1 divided by that margin.
Our own calculator's reference table makes the relationship concrete: a 20% margin breaks even at 5.00x, 30% at 3.33x, 40% at 2.50x, 50% at 2.00x, 60% at 1.67x, and 75% at 1.33x. Read that table twice, because it overturns the usual bragging order. A store with a 25% margin needs 4.00x just to stand still, so its celebrated 3.5x is a loss-maker.
A store with a 60% margin profits at 1.8x, a number most agencies would apologise for. Anyone quoting you a benchmark ROAS without asking about your costs is guessing with your money — there is no universal "good" ROAS, only a ROAS above your break-even.
One warning before the worked example: contribution is not the same as net profit. It excludes fixed overheads — rent, salaries, software — unless you deliberately build a per-order share of them into your costs. Break-even ROAS tells you when ads stop losing money on the order itself.
It does not promise the business as a whole is profitable. Keep the two questions separate and both answers stay honest.
Worked example: one 80-dollar order, step by step
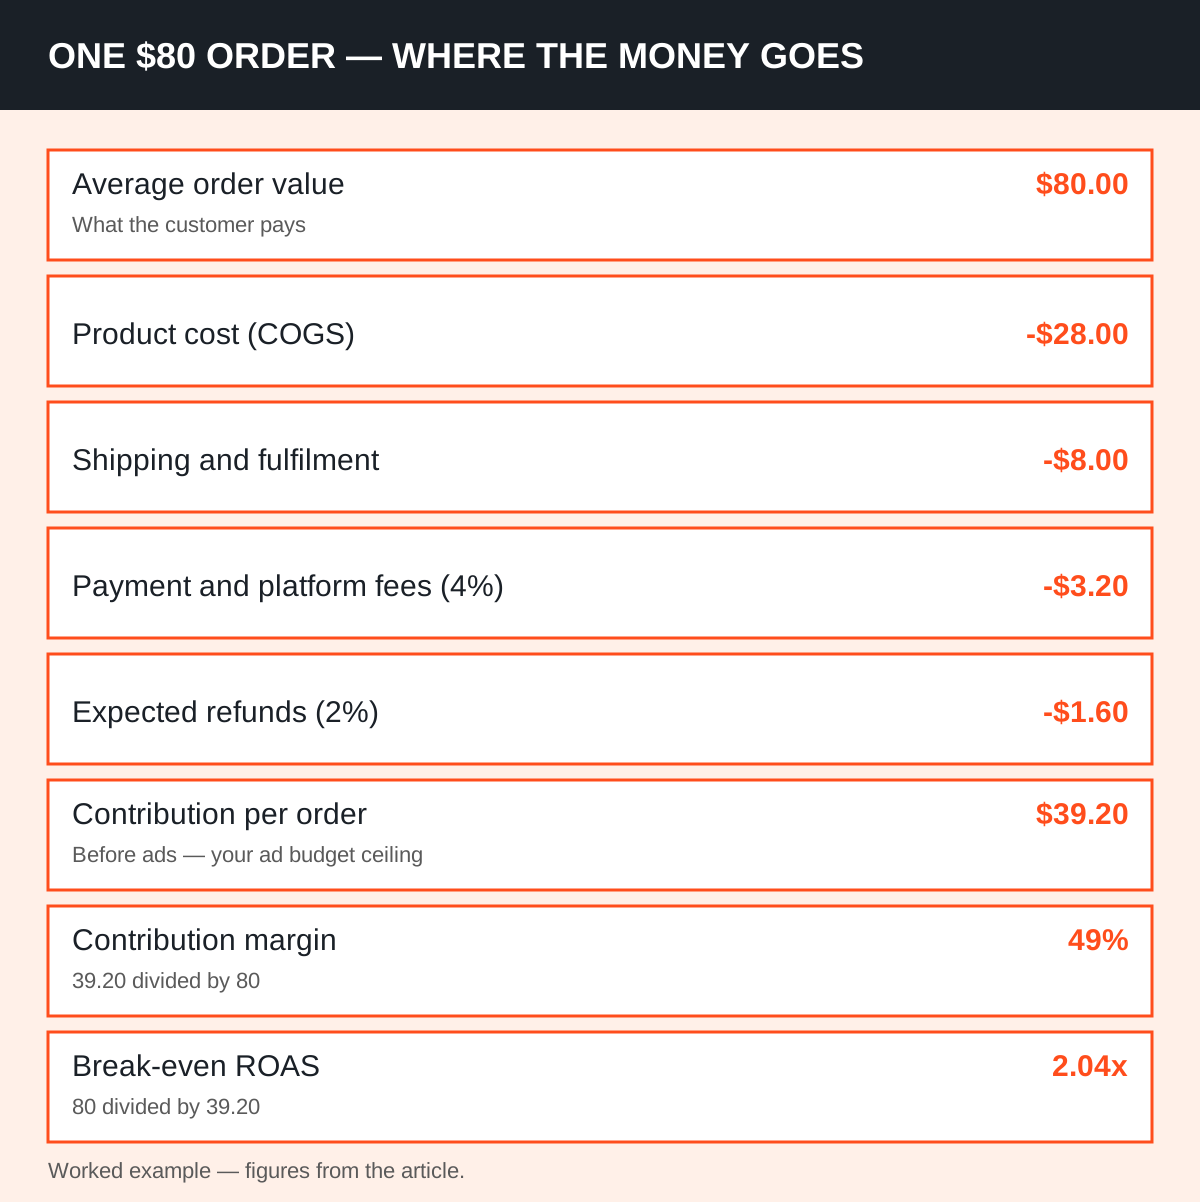
Take a store selling an average order of 80 dollars. Product cost per order is 28 dollars. Shipping and fulfilment run 8 dollars.
Payment and platform fees take 4% of order value, which is 3.20 dollars. (Fee schedules are published by the platforms themselves — see Shopify's pricing page for one example.) Expected refunds run 2% of order value, which is 1.60 dollars. Add the costs: 28 plus 8 plus 3.20 plus 1.60 equals 40.80 dollars.
Subtract from the order value: 80 minus 40.80 leaves a contribution of 39.20 dollars per order. The contribution margin is 39.20 divided by 80, which is 49%. Break-even ROAS is 1 divided by 0.49, which is 2.04x.
That 39.20 dollars is the most useful number in the whole article, because it is also the maximum ad cost per order. If acquiring an order costs 39.20 dollars in ads, the order contributes exactly that much, and profit on the order is zero.
Spend 45 dollars to acquire it and you lose 5.80 dollars per order, however impressive the ROAS looks — at 45 dollars of ad cost per 80-dollar order, ROAS is 1.78x, which sounds survivable until you compare it with the 2.04x floor. Spend 30 dollars and you keep 9.20 dollars per order.
The ROAS figure never changed its meaning; your comparison point did. Work this example with your own numbers before you read another dashboard, because every later decision in this article is just this calculation repeated.
Break-even is the floor, not the goal: finding your target ROAS
Breaking even is not a business plan. Nobody runs ads to make zero. The number you should actually run campaigns against is target ROAS: the ROAS at which, after ads, you keep the profit margin you want. The step from break-even to target is one more subtraction.
Decide the profit you want per order, subtract it from the contribution, and the remainder is your new maximum ad cost per order. Divide the order value by that figure and you have target ROAS.
Stay with the same 80-dollar order. Contribution is 39.20 dollars. Suppose you want to keep 20% of the order value as profit after ads — that is 16 dollars per order. Maximum ad cost per order becomes 39.20 minus 16, which is 23.20 dollars. Target ROAS is 80 divided by 23.20, which is 3.45x.
Notice what changed and what did not: the break-even floor is still 2.04x, and any campaign between 2.04x and 3.45x is profitable but below your goal. That middle band is where most ad accounts actually live, and naming it changes the conversation.
A campaign at 2.8x is not "underperforming" in some absolute sense — it is profitable, short of target, and the fix is either cheaper acquisition or a better margin, not panic. Run campaigns to your target; treat break-even as the floor you never plan to sit on.
The ROAS ladder: what each level means in dollars
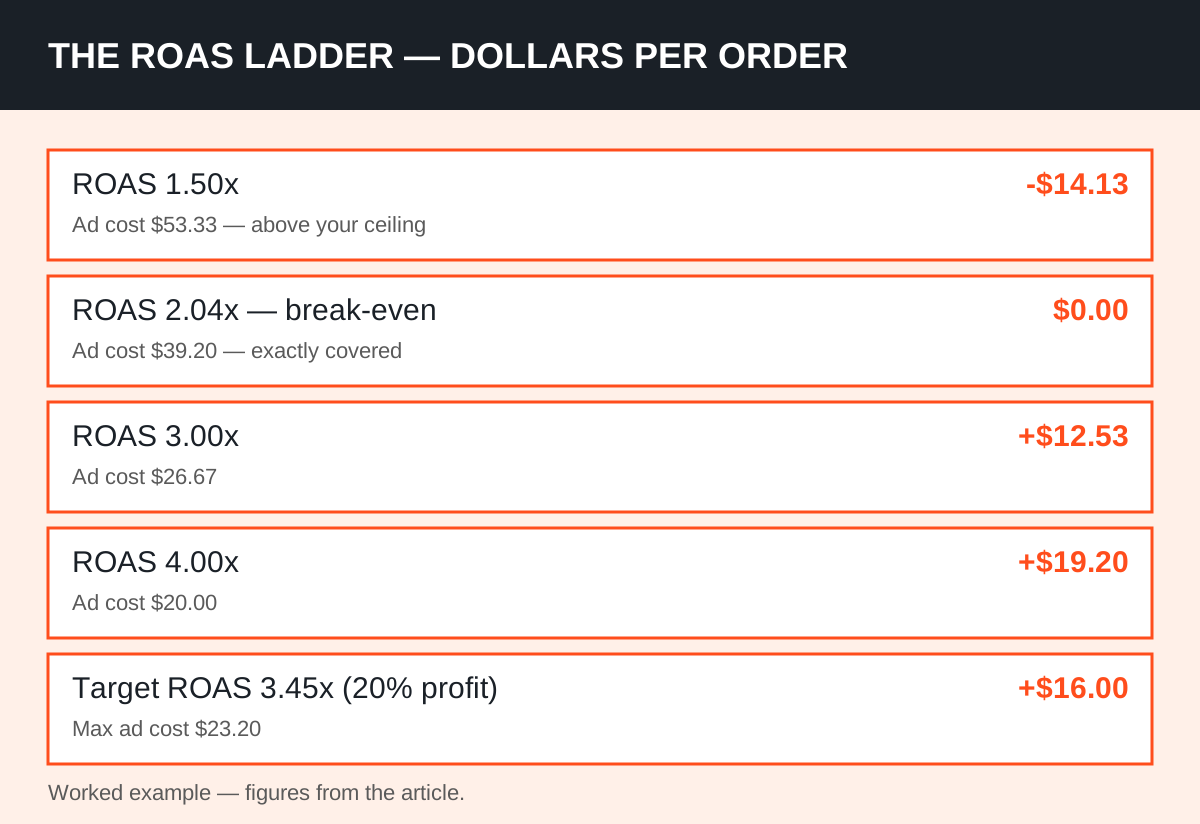
Percentages and multiples are easy to nod at and hard to feel. Turn them into dollars per order and the ladder is unmistakable. At a 1.50x ROAS on the 80-dollar order, ad cost per order is 53.33 dollars, which is 14.13 dollars more than the 39.20-dollar contribution — a loss of 14.13 dollars on every order the ads drive.
At the 2.04x break-even, ad cost is exactly 39.20 dollars and profit per order is zero. At 3.00x, ad cost falls to 26.67 dollars and profit per order is 12.53 dollars. At 4.00x, ad cost is 20 dollars and profit per order is 19.20 dollars.
At the 3.45x target, ad cost is 23.20 dollars and profit per order is the planned 16 dollars.
Two lessons hide in that ladder. First, the distance from disaster to comfort is smaller than it looks: the gap between losing 14 dollars an order and keeping 12 dollars an order is the gap between 1.50x and 3.00x — a swing most accounts see across a single creative refresh.
Second, ROAS improvements pay unevenly: moving from 3x to 4x adds 6.67 dollars of profit per order, while moving from 1.50x to 2.04x saves 14.13 dollars of loss. Fixing a below-break-even campaign is worth more than polishing a profitable one, which is exactly the opposite of where most optimisation time goes.
The ladder tells you where the money is; follow it.
Five mistakes that make a good ROAS lose money
First, judging ROAS before refunds. Dashboards count the full order value on day one; refunds arrive over the following days and weeks. A campaign that looks like 3x in week one can settle closer to 2.7x once returns clear — and if your break-even is 2.8x, that is the difference between profit and loss. Always compare settled ROAS against break-even, not day-one ROAS.
Second, blending new and returning customers. Returning customers would often have bought anyway, and their orders flatter the ROAS of whatever campaign touched them last. If prospecting campaigns are judged on blended numbers, the account keeps funding the campaigns that harvest existing demand and starves the ones creating it.
Third, forgetting fees and refunds in the margin. A margin calculated as price minus product cost alone is a fantasy margin. The 4% fees and 2% refunds in our example took 4.80 dollars off every order — enough to move break-even from 1.82x on a naive margin to the true 2.04x. Small percentages, applied to every order, are not small.
Fourth, chasing ROAS by cutting spend. ROAS rises when you spend less on the hardest-to-convert audiences — but profit is ROAS multiplied by volume, and a 5x ROAS on ten orders is worth less than a 3x ROAS on a hundred, if both sit above break-even.
A campaign can improve its ROAS and shrink the business at the same time. Judge scale by profit per order times orders, not by the ratio alone.
Fifth, setting one break-even for the whole store. Different products carry different margins, and different campaigns carry different average order values. A store-wide break-even is an average that describes no single campaign. Run the calculation per product group at least, and per hero product where the spend concentrates.
That is the same discipline as the per-sale arithmetic in our affiliate commissions guide — the percentage means nothing until it is turned into dollars for the specific product in front of you: https://learnwithmaneeza.com/tiktok-shop-affiliate-commissions-explained/
Your weekly ROAS routine, with the calculator doing the arithmetic
The method in this article takes five minutes once, and the habit that keeps it honest takes five minutes a week.
Once a month, or whenever a cost moves — a supplier price change, a new shipping rate, a fee increase, a refund-rate shift, a sale event that discounts margin — recompute contribution per order and both ROAS figures.
Weekly, compare each campaign's settled ROAS against its own break-even, not against the account average and not against a benchmark you read somewhere. Campaigns below break-even get fixed or paused first, because they lose money on every order.
Campaigns between break-even and target get one improvement each — a creative test, an audience change, a landing-page fix — and campaigns above target get the scale budget.
Doing that arithmetic by hand every time is a chore, which is why we built the tool for it.
Our Break-Even ROAS Calculator takes the same inputs this article used — average order value, product cost, shipping, fees, refunds, your current ROAS and the profit margin you want — and returns your break-even ROAS, contribution per order, target ROAS and maximum ad cost per order, plus the strategy written out in plain steps: https://learnwithmaneeza.com/roas-calculator/ — enter your numbers, read the two figures that matter, and set your campaign targets from them instead of from a benchmark.
If the account behind the numbers needs a full audit against its break-even rather than just the calculation, that is our paid social team's work: https://learnwithmaneeza.com/service/paid-social-ppc/ — and the same margin discipline applies to every channel we run, because a metric that ignores your costs will mislead you in any of them.
The dashboard will keep showing you ROAS. Let it. Just never read it alone again: put your break-even next to it, your target above it, and judge every campaign by the distance between the three. That is the only ad metric that tells you the truth — not because ROAS changed, but because you finally know what it is measured against.
Break-even ROAS by margin: the reference table
Keep this table next to your ad account. Find your contribution margin in the first column; the second is the ROAS you must beat to make money.
| Contribution margin | Break-even ROAS |
|---|---|
| 20% | 5.00x |
| 30% | 3.33x |
| 40% | 2.50x |
| 50% | 2.00x |
| 60% | 1.67x |
| 75% | 1.33x |
Run your own numbers in the Break-Even ROAS Calculator — it takes thirty seconds and settles most scaling arguments.
Frequently asked questions
What is break-even ROAS?
The ROAS at which ad spend exactly eats the contribution each order makes — profit per order is zero. It equals 1 divided by your contribution margin: a 49% margin breaks even at 2.04x, a 25% margin at 4.00x, and a 60% margin at 1.67x. Any campaign below its break-even loses money on every order it drives, whatever the dashboard number looks like.
What is a good ROAS?
There is no universal good ROAS — only a ROAS above your own break-even. A store with a 60% margin profits at 1.8x, while a store with a 25% margin loses money at 3.5x. Find your break-even from your own costs first, then set a target ROAS above it that leaves the profit margin you actually want. Anyone quoting a benchmark without asking about your costs is guessing with your money.
What is the difference between break-even ROAS and target ROAS?
Break-even ROAS is the floor where profit per order is zero; target ROAS is the level where, after ads, you keep the profit margin you want. On an $80 order with $39.20 of contribution, break-even is 2.04x, but a 20% profit target ($16 per order) needs a target ROAS of 3.45x. Run campaigns to your target; treat break-even as the floor you never plan to sit on.
Why does my ROAS look good but the business still loses money?
Usually one of four reasons: the dashboard counts revenue before refunds, it blends in returning customers who would have bought anyway, your margin calculation left out fees or refunds, or one store-wide ROAS hides a low-margin product group losing money. Compare settled, per-product ROAS against each group's own break-even — and use the calculator to work both figures out from your real numbers: https://learnwithmaneeza.com/roas-calculator/