
The guide
Every week, a marketer asks the same question: are my Meta Ads expensive, or is that just what Meta costs now? The honest answer starts with a correction. There is no single Meta Ads benchmark. A click bought for traffic, a lead bought for a service business, and a purchase bought for an online store are three different auctions, and comparing them against one average hides the only numbers that matter. This guide splits the 2026 benchmarks by objective, names the dataset behind each row, and shows how to turn a benchmark into a budget. The figures come from two large published datasets. WordStream by LocaliQ covers US traffic and leads campaigns. Triple Whale covers ecommerce brands buying sales on Meta. The headline is encouraging, with one warning attached. Clicks got cheaper in 2026 while engagement rose. But impressions got more expensive for online stores, so a cheaper click does not automatically mean a cheaper customer. Read the objective row that matches your campaign, and ignore the rest.
Meta Ads benchmarks for 2026, split by objective: traffic clicks, lead costs and ecommerce sales, each with its dataset, its spread by industry, and a worked budget example.
Key takeaways
Why is there no single Meta Ads benchmark?
Meta does not sell ads at a fixed price. It runs an auction, and the price you pay depends on what you ask Meta to find. A person likely to click a link is common. A person likely to buy a product today is scarce, and every competing brand is bidding for the same person.
That scarcity is why sales and leads cost more than traffic, even before creative or industry enters the picture.
Objective is therefore the first filter, not a detail. A traffic campaign optimises for clicks, so Meta shows your ad to likely clickers. A leads campaign optimises for form completions, so it chases a smaller, harder pool. A sales campaign optimises for purchases, the smallest pool of all.
Judge a traffic campaign against traffic numbers and a sales campaign against sales numbers, or the comparison tells you nothing.
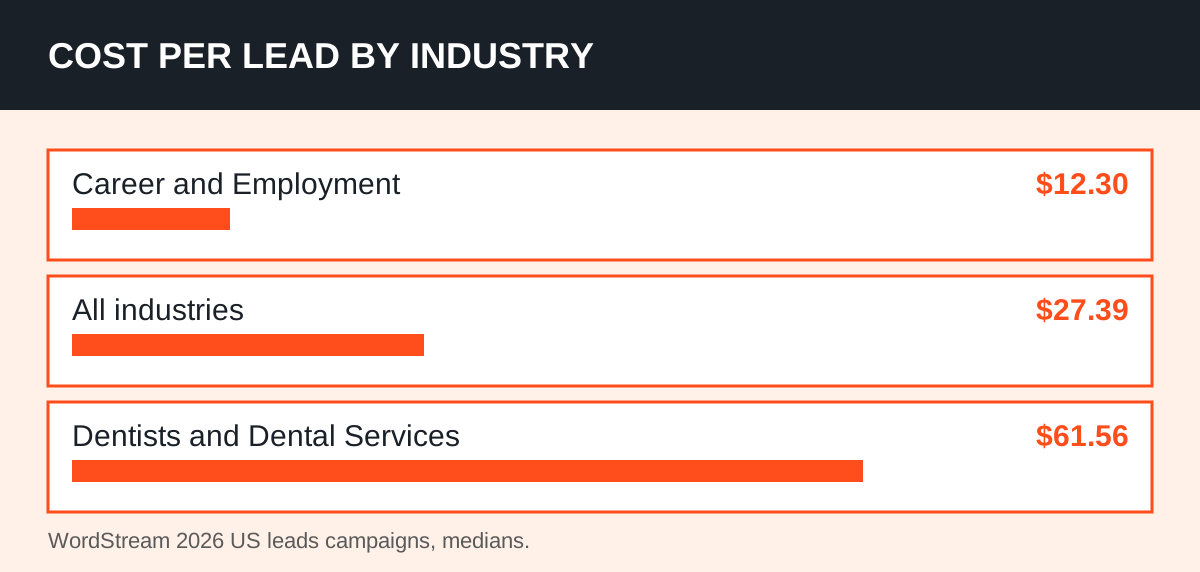
Industry is the second filter. In WordStream's leads data, a lead costs $12.30 in career and employment but $61.56 for dentists. That fivefold spread is not an error. It is different competition, different customer value, and different intent. An all-industry median is a starting point for planning, never a verdict on your account.
What are the 2026 benchmarks by objective?
Start with the table, then read the warnings under it. Each row comes from a different dataset, and the gaps are deliberate. WordStream reports traffic and leads in detail but publishes no CPM for either. Triple Whale reports ecommerce sales in detail, across all objectives combined rather than split by objective.
| Objective | Dataset | CTR | CPC | CPM | Cost per result |
|---|---|---|---|---|---|
| Traffic | WordStream 2026, US | 1.93% | $0.60 | Not published | n/a — traffic does not optimise for conversions |
| Leads | WordStream 2026, US | 2.70% | $1.80 | Not published | $27.39 per lead, 8.54% conversion rate |
| Sales (ecommerce) | Triple Whale, Aug 2025–Jul 2026 | 2.39% | About $0.63 by arithmetic | $15.06 | $38.99 per purchase, 1.88 ROAS |
Two warnings matter more than the table. First, WordStream's figures are US campaigns from April 2025 to June 2026: 1,377 traffic campaigns and 452 leads campaigns. They are not global figures, and small industry rows rest on few campaigns. Second, Triple Whale's panel is 40,000-plus ecommerce brands on its own platform, from August 2025 to July 2026.
It describes online stores, not service businesses or lead generation.
The ecommerce CPC in the table is our arithmetic, not a published figure. Triple Whale publishes CPM and CTR but no CPC. Divide $15.06 by 1,000 impressions times a 2.39% click rate, and you get about $0.63 per click. It is shown so the rows can be compared, and labelled as arithmetic for exactly that reason.
What do traffic campaigns cost, industry by industry?
WordStream's 2026 Facebook Ads Benchmarks puts traffic campaigns at a 1.93% click-through rate, up from 1.71% a year earlier, and a $0.60 cost per click, down from $0.70. That is the rare good-news combination: more people clicked, and each click cost less. It does not mean traffic got easier.
It means the median traffic campaign performed better, and the median is not your campaign.
Industry moves the click price more than the headline suggests. Arts and entertainment pays $0.34 per traffic click, travel $0.42, and restaurants and food $0.45. At the other end, finance and insurance pays $0.86, automotive repair $0.74, and apparel and jewellery $0.71.
A click in finance costs two and a half times a click in arts and entertainment, before either campaign has written a headline.
Click-through rate spreads just as widely. Beauty and personal care leads traffic CTR at 2.73%, with arts and entertainment at 2.71% and restaurants and food at 2.68%. Finance and insurance sits at 1.46%, automotive for sale at 1.47%, and education at 1.50%. If your traffic CTR sits below 1%, fix the creative and the offer before you blame the auction.
If it sits above 2%, your problem is probably further down the funnel.
Traffic is also the easiest benchmark to misuse. A cheap click is only valuable if the landing page converts it. Our guide to how much Google Ads cost in 2026 makes the same point for search: a low click price with a weak page is just cheap disappointment, bought in bulk.
Why do lead costs swing from $12 to $62?
Lead campaigns are where benchmarks earn their keep, because the spread is so wide that the average misleads everyone. WordStream's 2026 Facebook Ads Benchmarks puts leads campaigns at a 2.70% click-through rate, a $1.80 cost per click, an 8.54% conversion rate, and a $27.39 cost per lead.
The cost per lead barely moved year on year, down just under 1% from $27.66, even as clicks got cheaper and conversion improved.
The industry spread is the story. Career and employment leads cost $12.30, real estate $13.74, and arts and entertainment $14.59. Home improvement leads cost $42.95, beauty and personal care $50.91, and dentists $61.56. A dentist paying $40 per lead is beating its industry median. A recruiter paying $40 per lead is paying more than three times its industry median.
Same number, opposite verdict.
Two cautions apply before you celebrate or panic. First, a recorded lead is not a qualified lead, and it is certainly not a sale. On-platform forms convert at higher rates than landing pages, but the leads often qualify worse. Judge a lead campaign on cost per qualified lead and cost per sale, not on cost per form alone.
Second, the leads sample is smaller than the traffic sample, with some industry rows resting on very few campaigns. Treat a single industry figure as direction, not as a quote.
What does a sale cost on Meta for ecommerce stores?
Ecommerce is the third auction, and its numbers come from a different panel. Triple Whale's Facebook Ad Benchmarks covers more than 40,000 brands from August 2025 to July 2026.
Its medians are a $15.06 CPM, up 13.24% on the year before, a 2.39% click-through rate, up 15.97%, a 1.53% conversion rate, a $38.99 cost per purchase, and a 1.88 return on ad spend.
Read those five numbers together, because alone each one lies. Click-through rose sharply, which means creative and formats engaged people better. Conversion fell slightly, from 1.60% to 1.53%, which means more of those clicks did not become orders. Impressions got 13% dearer while the cost per purchase rose only 3%, because better engagement partly absorbed the dearer auction.
A store that only watched CPM would have panicked. A store that only watched CTR would have celebrated. Neither story was complete.
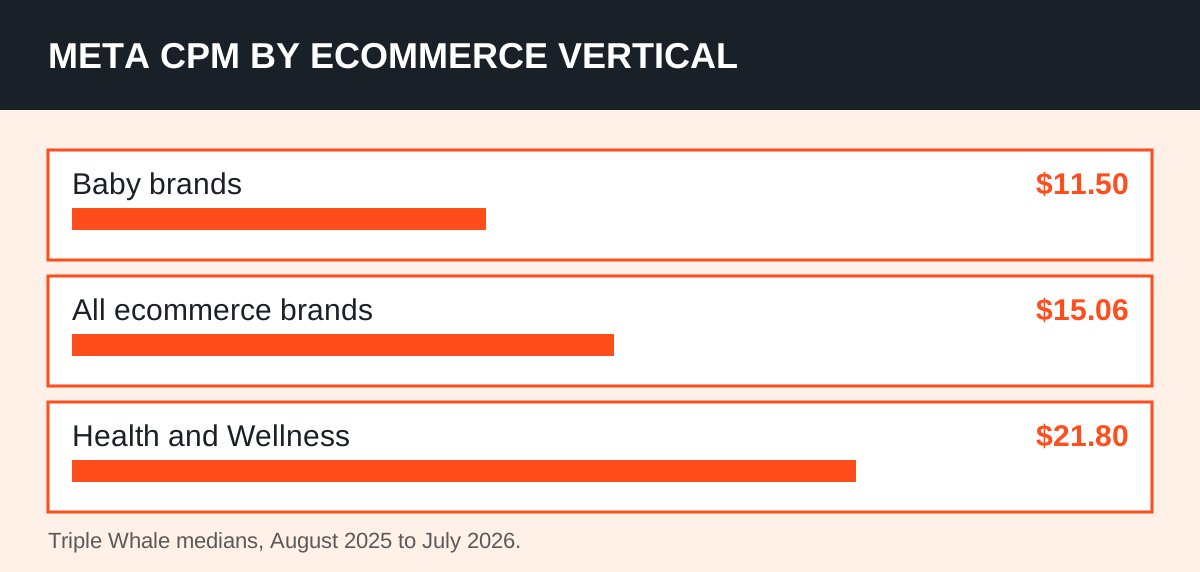
Verticals move every figure. Health and wellness pays the highest median CPM at $21.80, while baby brands pay the lowest at $11.50. Cost per purchase runs from $26.80 for e-learning and online courses to $51.86 for electronics. Return on ad spend runs from 1.13 for media and publishing to 2.35 for sports and outdoors.
If your store sells electronics, a $39 cost per purchase is already a win. If it sells courses, the same figure is a warning.
The median return of 1.88 also deserves a plain reading. It means the median brand got $1.88 back for every $1 of Meta spend, before product costs, fees, fulfilment and refunds. That is revenue, not profit. A store with thin margins can lose money at a 1.88 return, while a store with strong margins can profit at a lower one.
Benchmarks describe the auction. Margins decide whether the auction is worth entering.
How do you turn a benchmark into a budget?
Start from the result you need, not from a round budget number. Pick your objective row, take its cost per result, and multiply by the results you want. That gives a planning budget. Then check it against two reality tests: learning volume, and your own break-even point.
For leads, the arithmetic is blunt. At the $27.39 median, 50 leads a week costs about $1,370 a week, or roughly $5,900 a month, for one ad set. Fifty matters because Meta's own guidance puts the learning-phase bar at about 50 optimisation events in the week after an ad set's last significant edit.
Spread that budget across five ad sets and none of them learns. Fewer, larger ad sets beat many thin ones, every time.
For ecommerce, work from the $38.99 median cost per purchase. A $1,000 monthly test buys about 26 purchases at that rate, and at the 1.88 median return it brings back about $1,880 in revenue. Whether that is good depends entirely on your order value and margin.
That is why the benchmark table alone never answers the real question, which is what you can afford to pay.
Our ROAS calculator turns that question into a number: enter your price, costs and margin, and it shows the break-even return your ads must beat. Our break-even ROAS guide explains the method behind it, step by step. If the benchmark cost per purchase sits above your break-even, fix the offer, the page or the margins before you scale spend.
More budget on an unprofitable funnel just loses money faster.
What should you fix first when you miss the benchmark?
Diagnose by the metric that misses, not by the metric that looks worst. Each miss points at a different part of the funnel, and fixing the wrong part wastes the budget you were trying to save.
If click-through rate is low, the ad itself is the problem: the hook, the image or video, or the offer in the first three seconds. Test new creative before you touch audiences or budgets, because no audience fix rescues an ad people scroll past.
If click-through is healthy but cost per click is high, the auction is telling you the audience is competitive or narrow. Broaden the audience, or accept that your industry simply pays more for attention.
If clicks are cheap but conversion is low, the landing page is the problem, not the ad. Slow load, a mismatched promise, or a form that asks too much will waste good traffic. If leads are cheap but sales are rare, the lead quality is the problem.
Add qualifying questions, or send traffic to a landing page instead of an on-platform form, and judge the change on qualified leads.
Finally, re-check before you conclude anything. Compare against your own industry row and your own objective, not against a blended platform average. Compare at least a few weeks of data, not three days, because early delivery is unstable while Meta learns.
And if paid social is part of a wider plan, our paid social and PPC service page shows how benchmarks fit alongside search, creative and tracking, rather than standing alone as a verdict.
Frequently asked questions
What is a good CPM for Meta Ads in 2026?
For ecommerce brands, Triple Whale's median is $15.06 for August 2025 to July 2026, ranging from $11.50 for baby brands to $21.80 for health and wellness. WordStream publishes no CPM for traffic or leads campaigns, so there is no single "good CPM" across objectives — compare your CPM against your own vertical and objective, and judge it alongside click-through rate and cost per result.
What is a good CPC for Meta Ads in 2026?
WordStream's 2026 US medians are $0.60 per click for traffic campaigns and $1.80 per click for leads campaigns. A good CPC depends on what the click does next: a $0.60 traffic click that never converts is worse than a $1.80 lead click that becomes a customer, so always pair CPC with conversion rate and cost per result.
What is a good CTR for Meta Ads in 2026?
WordStream reports 1.93% for traffic campaigns and 2.70% for leads campaigns, while Triple Whale reports 2.39% for ecommerce brands. Below 1% on a traffic campaign usually signals a creative or offer problem. Above 2% means the ad is doing its job, and any remaining problem sits on the landing page or in lead quality.
How much should a small business budget for Meta Ads?
Work backwards from the result you need. At WordStream's $27.39 median cost per lead, 50 leads a week needs roughly $5,900 a month for one ad set. At Triple Whale's $38.99 median cost per purchase, $1,000 buys about 26 purchases. Check both figures against your break-even return before you scale, and keep ad sets few enough that each one can reach about 50 optimisation events a week.