
The guide
"What percentage of revenue should we spend on marketing?" It is the first question every ecommerce founder asks — and the most common answer, a single number quoted from a survey, is the least useful one. The most quoted figure, Gartner's 7.8% of revenue, comes from companies mostly above $1 billion in revenue. A store doing $50,000 a month cannot buy growth at 7.8% — the dollars are too small to test anything properly. This guide gives you the benchmarks by stage — 20–30% at startup, 12–18% in growth, 8–15% at scale — and the margin maths that turns a benchmark into your budget. No survey can set your number. Your margin can.
The stage benchmarks from 8% to 30% of revenue, why Gartner's 7.8% is an enterprise number, the margin formula that sets your ceiling, where the budget goes at each stage, and the three numbers that tell you to raise or cut it.
Key takeaways
Why there is no single "right" percentage
Every ecommerce founder asks the same question: what percentage of revenue should go to marketing? The honest answer is that no single number fits every store.
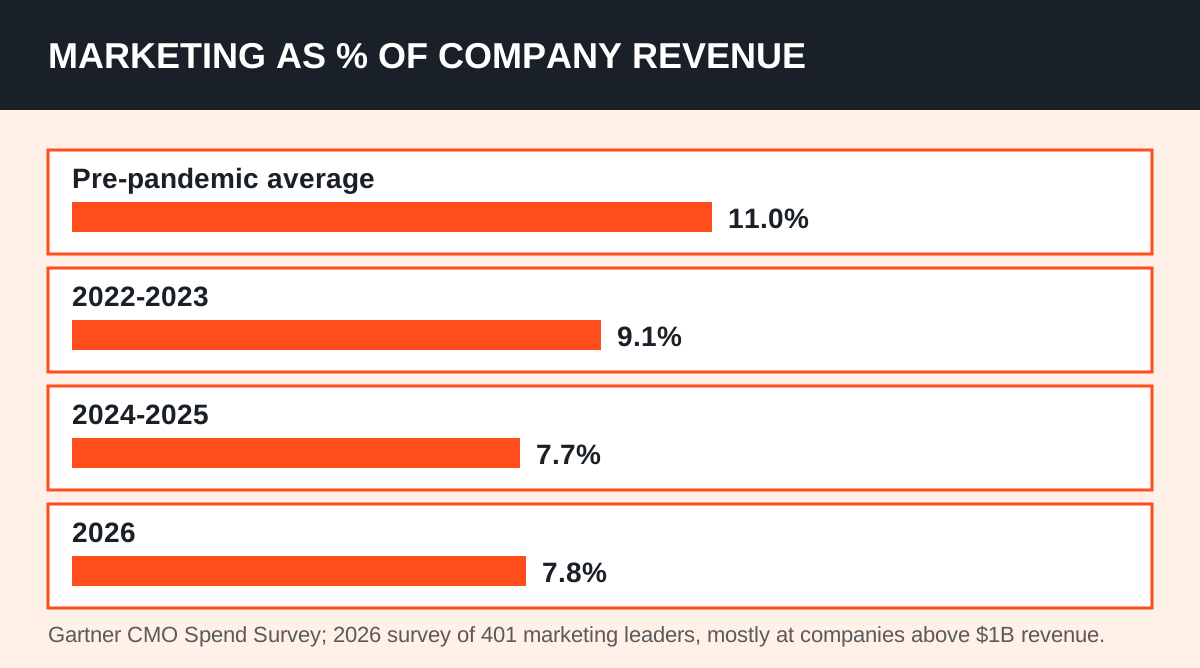
The most quoted figure comes from Gartner. Its 2026 CMO Spend Survey puts marketing budgets at 7.8% of company revenue, up from 7.7% in 2025. But that survey covers 401 marketing leaders, mostly at companies above $1 billion in revenue. It is an enterprise average, not a store target.
Smaller stores spend far more. A store doing $50,000 a month cannot buy growth at 7.8% of revenue — the absolute dollars are too small to test channels properly. The percentage has to fall as the store grows, because the same dollars buy more once the brand is known.
The number that matters is your own ceiling. It comes from your margin, not from a survey. The Brand Captain's DTC budget guide states it as a formula: marketing ceiling = contribution margin − fixed costs − target profit. Everything in this guide hangs off that formula.
Contribution margin is what is left after the cost of the product, shipping and payment fees. Fixed costs are rent, salaries and software. Target profit is what you want to keep. If the formula gives 15%, then 15% is the most marketing can take before the store stops making money.
What do the benchmarks say by stage?
With the formula in mind, the benchmarks become useful. They show the range other stores land in — not a target, but a sanity check.
| Stage | Annual revenue | Marketing as % of revenue | The money's main job |
|---|---|---|---|
| Startup | Under $1 million | 20–30% | Find a product and a channel that sell at a profit |
| Growth | $1 million to $10 million | 12–18% | Scale the winners and build retention |
| Scale | $10 million and up | 8–15% | Protect profit and grow lifetime value |
Those ranges come from WebFX's 2026 ecommerce benchmarks report. Note how wide they are: a startup at 20% and a startup at 30% are both normal. The range is the point — the stage sets the band, and your margin picks the point inside it.
The enterprise trend runs the other way. Gartner's 2026 CMO Spend Survey press release shows marketing budgets at 7.8% of revenue in 2026 — barely above 7.7% in 2025, and well below the 9.1% of 2022–2023 and the roughly 11% average of the four years before the pandemic.
More than half of the CMOs in that survey — 56% — said they do not have the budget to deliver their 2026 strategy. Flat budgets are the enterprise reality. A growing store should not copy that flatness: its budget is an investment, not a cost centre to hold flat.
The other large survey agrees on the direction. Duke University's CMO Survey, in its January 2026 edition, put marketing at 9.0% of revenues across 308 US marketing leaders — with B2C product companies higher, at 12.0%. Different samples, same message: the average sits near 8–9%, and consumer brands sit above it.
Where does the money go inside the budget?
The percentage is only half the budget. The other half is the split — and the split changes with stage, too.
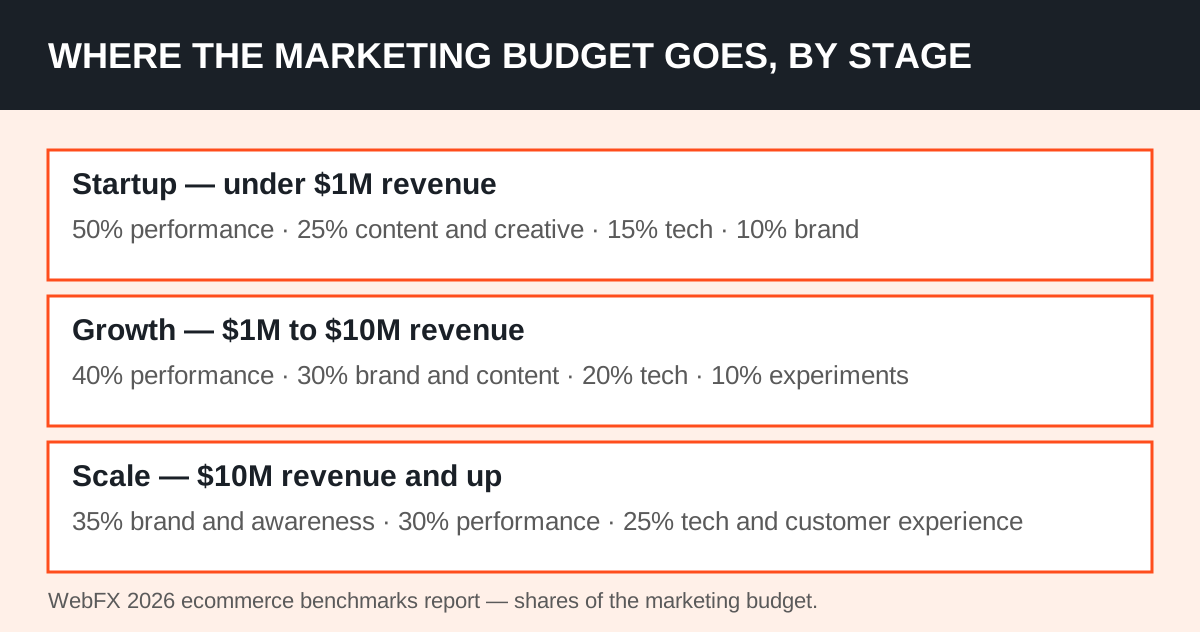
At startup stage, half the marketing budget goes to performance marketing: paid search and paid social that bring immediate sales. A quarter goes to content and creative, 15% to technology and automation, and 10% to brand building. The logic is simple: nothing else matters until one channel reliably sells.
In the growth stage, performance drops to 40% and brand building rises to 30%, with 20% on technology and 10% on experimental channels. The store now has winners to scale, so it can afford to invest in the brand that makes the next click cheaper.
At scale, the split flips: 35% goes to brand marketing and awareness, 30% to performance, and 25% to technology and customer experience. A known brand buys awareness because awareness is what protects its price.
Watch the pattern, not the exact numbers. Performance share falls as the store matures; brand and retention shares rise. If your $5 million store still spends 80% of its budget on cold paid ads, the split is telling you the brand never caught up.
One split inside the total deserves its own line. Gartner's 2026 survey puts paid media at 31.4% of the average marketing budget, up from 30.6% in 2025.
At a 7.8% total budget, that is about 2.4% of company revenue going to paid media at a large enterprise. A small store's paid share will be far higher — most of its budget is paid media at the start.
How do you turn a percentage into a monthly budget?
Benchmarks become a budget with three numbers from your own books: monthly revenue, contribution margin, and fixed costs. The ceiling formula does the rest.
Take a store doing $50,000 a month. Its contribution margin — after product, shipping and fees — is 45%. Fixed costs run 20% of revenue. It wants to keep 10% as profit. The ceiling is 45 − 20 − 10 = 15% of revenue, or $7,500 a month for marketing. That is the maximum, not the target.
Now check what that ceiling buys. Marketing efficiency ratio (MER) is revenue divided by marketing spend: $50,000 ÷ $7,500 = 6.7. Every $1 of marketing has to return $6.70 in revenue. If the store's blended return is below that, the budget has to shrink — or the margin has to grow.
Paid ads get a stricter test. With a 45% contribution margin, break-even ROAS is 1 ÷ 0.45 = 2.22. Any paid campaign below 2.22x loses money on the first order, whatever the dashboard says. Our break-even ROAS guide works through the same maths in detail, and our free ROAS calculator turns your margin and costs into the number in seconds.
A second store shows why margin matters more than revenue. It also does $100,000 a month, but with a 60% contribution margin, 15% fixed costs and a 10% profit target.
Its ceiling is 60 − 15 − 10 = 35% — $35,000 a month. Same revenue band as the first store's bigger cousin, more than double the affordable budget. The margin is the budget.
Set the budget as a range, not a point. Take the ceiling, then plan to spend 70–80% of it in a normal month and keep the rest for tests and seasonal pushes. A budget with no test money is a budget that never finds a better channel.
What pushes your percentage up or down?
Two stores at the same stage can sit at opposite ends of the benchmark range. Four things explain most of the gap.
Category comes first. WebFX's 2026 report puts the median cost to acquire a customer at $156 — but apparel stores acquire at about $72 while jewellery sits near $350 and consumer electronics near $750. An electronics store has to spend far more per customer, so its percentage runs higher at the same revenue.
Average order value comes second. A $20 product needs far more orders — and far more ad spend — to reach the same revenue as a $200 product. Low AOV stores live at the top of the range; high AOV stores can live at the bottom.
Repeat purchase rate comes third. A store whose customers reorder twice a year can afford to spend more to win each one, because the first order is not the whole return. A one-and-done store cannot. This is why the ceiling formula uses margin per customer, not margin per order.
Channel mix comes fourth. Email returns 6–10x ROAS in WebFX's data, paid search 4–6x, paid social 3–5x, affiliates 3–7x and influencers 2–4x.
A store with a strong email list spends a smaller share of revenue because its cheapest channel does more of the work. Our guide to how much Shopify marketing costs breaks down where that spend actually lands month to month.
Which three numbers say raise or cut the budget?
A budget set once and forgotten is a budget that drifts. Three numbers tell you whether to move it, and in which direction.
First, MER — total revenue divided by total marketing spend. A MER of 4 means marketing is 25% of revenue; a MER of 6.7 means 15%. Track it weekly. If MER holds steady while spend rises, the budget can rise. If MER falls as spend rises, you have found the edge of what your channels can absorb.
Second, the LTV-to-CAC ratio: the lifetime value of a customer against what it cost to win them. Below 3:1, acquisition is too expensive for the value it creates — cut the budget or fix the funnel first.
Above 3:1 with a stable payback, there is room to spend more. Our Meta Ads benchmarks give the CPM, CPC and CTR ranges to sanity-check the CAC side.
Third, the new-customer share. If more than 70% of revenue comes from new customers, the store is renting its growth — every month starts at zero. Shift budget toward retention (email, SMS, loyalty) until repeat revenue carries a third of the total. Retention spend is the cheapest growth a store can buy.
Review the three numbers monthly, not daily. Daily noise will push you to cut a channel the week before it pays off. Monthly, the trend is honest.
How do you set your budget this week?
You do not need a finance department. One afternoon, four steps, and the budget is set.
Step one: pull your last three months of revenue, contribution margin and fixed costs from your books. Use real numbers, not the ones you wish were true. A ceiling built on guessed margin is a guess.
Step two: run the ceiling formula — contribution margin minus fixed costs minus target profit. That is your maximum. Then set the working budget at 70–80% of the ceiling, and check it against the stage range above. If your ceiling sits far outside the range, the problem is the margin, not the marketing.
Step three: split the working budget by your stage — performance-heavy at startup, brand-heavy at scale — and give every channel a job with a number attached.
Paid social buys new customers; email and SMS buy repeat orders; content buys the clicks you will not have to pay for next year. Our paid social and PPC service runs this split for stores that want the buying done for them.
Step four: pick the three numbers from section 06 and put them on one page you actually look at. MER weekly, LTV-to-CAC and new-customer share monthly. The budget is not a document — it is a dial you turn when the numbers move.
And if the numbers still feel abstract, start with the calculator: our free ROAS calculator takes your margin and costs and tells you the break-even ROAS your ads must beat. Set the budget from the margin up, and the benchmarks will stop feeling like guesses.
Frequently asked questions
What percentage of revenue should an ecommerce business spend on marketing?
It depends on stage and margin. WebFX's 2026 benchmarks put startups under $1M at 20–30% of revenue, growth-stage stores at 12–18%, and stores above $10M at 8–15%. The real ceiling comes from your own margin: contribution margin minus fixed costs minus target profit. Use the benchmarks as a sanity check, not a target.
What is a good marketing efficiency ratio (MER) for ecommerce?
MER is total revenue divided by total marketing spend. A MER of 4 means marketing is 25% of revenue; a MER of 6.7 means 15%. There is no universal good number — it has to clear your contribution margin maths. If MER holds steady while you spend more, the budget can grow; if it falls as spend rises, you have hit the edge of what your channels can absorb.
How much of a marketing budget should go to paid ads?
At large enterprises, Gartner's 2026 survey puts paid media at 31.4% of the marketing budget. Small ecommerce stores spend far more — most of the budget is paid media at startup stage, roughly half, falling as brand and retention grow. The split should follow the stage: performance-heavy early, brand-heavy at scale.
How do I calculate my ecommerce marketing budget?
Take your contribution margin (revenue minus product, shipping and fees), subtract fixed costs and your target profit — the result is the maximum share of revenue marketing can take. Set the working budget at 70–80% of that ceiling, split it by stage, and check it monthly against MER, LTV-to-CAC and new-customer share.